Richard Harris begins a series of articles exploring some of the mathematics of interest to those modelling problems with computers. Part 1: The Regular Travelling Salesman.
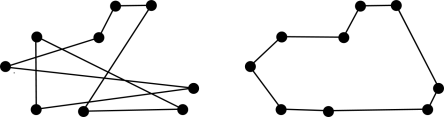
The travelling salesman problem, or TSP, must be one of the most popular problems amongst computer science students. It is extremely simple to state; what is the shortest route by which one can tour n cities and return to one's starting point? Figure 1 shows random and optimal tours of a 9-city TSP.
|
|
Figure 1
|
On first inspection, it seems to be fairly simple. The 9-city tour in figure 1 can be solved by eye in just a few seconds.
However, the general case is fiendishly difficult. So much so that finding a fast algorithm to generate the optimal tour, or even proving that no such algorithm exists, will net you $1,000,000 from the Clay Mathematics Institute [ Clay ].
This is because it is an example of an NP-complete (nondeterministic polynomial complexity) problem. This is the class of problems for which the answer can be checked in polynomial time, but for which finding it has unknown complexity. The question of whether an NP-complete problem can be solved in polynomial time is succinctly expressed as 'is P equal to NP?' and answering it is one of the Millennium Prize Problems, hence the substantial cash reward.
The answer to this question is so valuable because it has been proven that if you can solve one NP-complete problem in polynomial time, you can solve them all in polynomial time. And NP-complete problems turn up all over the place.
For example, secure communication on the internet relies upon P≠NP.The cryptographic algorithms used to make communication secure depend on functions that are easy to compute, but hard to invert. If P=NP then no such functions exist and secure communication on an insecure medium is impossible. Since every financial institution relies upon such communication for transferring funds, I suspect that you could raise far more than $1,000,000 if you were able to prove that P=NP. Fortunately for the integrity of our bank accounts the evidence seems to indicate that if the question is ever answered it will be in the negative.
So, given that some of the keenest minds on the planet have failed to solve this problem, what possible insights could an amateur modeller provide?
Not many, I'm afraid. Well, not for this problem exactly.
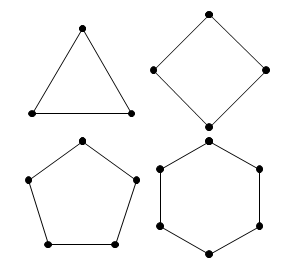
I'd like to introduce a variant of the TSP that I'll call the regular travelling salesman problem. This is a TSP in which the cities are located at the vertices of a regular polygon. Figure 2 shows the first four regular TSPs.
|
|
Figure 2
|
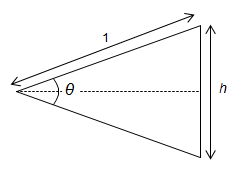
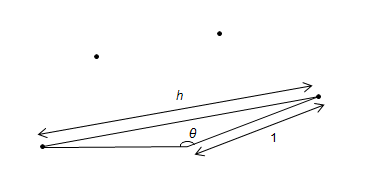
The question of which is the shortest tour is rather uninteresting for the regular TSP as it's simply the circumference of the polygon. Assuming that the cities are located at unit distance from the centre of the polygons (i.e. the polygons have unit radius), the length of the optimal tour can be found with a little trigonometry. Figure 3 shows the length of a side.
|
|
Figure 3
|
For a tour of n cities, the length, l , of the optimal tour is given by:
    2π
θ = ——
     n

    θ   h
sin — = —
    2   2

                    π
l = n × h = 2 n sin —
                    n
As n gets large, so θ gets small, and for small θ , sinθ is well approximated by θ itself. We can conclude, therefore, that for large n , the length of the optimal tour is approximately equal to 2θ . This shouldn't come as much of a surprise since for large n a polygon is a good approximation for a circle. In fact, it was this observation that Archimedes [ Archimedes ] used to prove that
The ratio of the circumference of any circle to its diameter is less than 31 / 7 but greater than 310 / 71 .
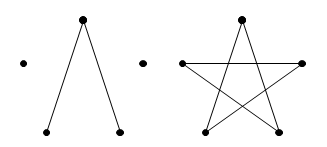
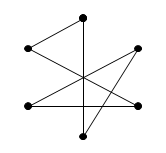
It's also fairly easy to find the length of the most sub-optimal tour. The key is to note that for odd n the furthest two cities from any given city are those connecting the opposite side of the polygon. Figure 4 shows the longest single steps and tour in a 5-city regular TSP.
|
|
Figure 4
|
For odd regular TSPs, we can take a step of this length for every city, giving us a star shaped tour. We can calculate the length of this tour in a similar way to that we used to calculate the shortest tour length. Figure 5 shows the length of the longest single step.
|
|
Figure 5
|
So for a tour of odd n cities, the length, l' , of the worst tour is given by:
    2π   n-1       π
θ = —— × ——— = π - —
     n    2        n

    θ   h
sin — = —
    2   2
                     ⌈ π    π ⌉            π
l' = n × h = 2 n sin | — - —— | = 2 n cos ——
                     ⌊ 2   2n ⌋           2n
This time for sufficiently large n , is small enough that cos θ is well approximated by 1 . For large odd n , therefore, the length of the worst tour is approximately equal to 2 n . Once again, we could have equally well concluded this from the fact that for large n the polygon is a good approximation for a circle for which the largest step is across the diameter.
For an even number of cities the worst single step is to the city on the opposite side of the polygon with a distance of 2. Unfortunately each time we take such a step we rule it out for the city we visit, which will have to take a shorter step. So we can have ½ n steps of length 2 and ½ n steps of length strictly less than 2, giving a total length strictly less than 2 n .
This doesn't show that for an even number of cities the limit is 2 n , just that it cannot exceed 2 n . However, we can follow the longest step with the second longest to one of the first city's neighbours. We can repeat this for all but the last pair of cities for which we can take the longest step followed by the shortest. Figure 6 shows a 2 n -2 limit tour for 6 cities.
|
|
Figure 6
|
Whilst I haven't shown that this is the worst strategy, it does have a limit close to 2 n for large n . It takes ½ n steps with length 2, ½ n -1 steps with length approximately equal to 2 and one step with length approximately equal to 0 giving a total of 2 n -2.
So are there any remotely interesting questions we can ask about the regular TSP?
How about what the average length of a tour is? Or, more generally, how are the lengths of random regular TSP tours distributed?
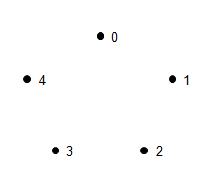
This is where the maths gets a little bit tricky, so we'll need to write a program to enumerate the tours directly. The simplest way to do this is to assign each city a number from 0 to n -1 so we can represent a tour as a sequence of integers. Figure 7 shows labels for a 5-city regular TSP.
|
|
Figure 7
|
A tour can be defined as:
    #include <vector>
      namespace tsp
      {
        typedef std::vector<size_t> tour;
      }
We'll need some code to calculate the distance between the cities. We can save ourselves some work if we calculate the distances in advance rather than on the fly. We can exploit the fact that our cities are located at the vertices of regular polygons by noting that due to rotational symmetry the distance between two cities depends only on how may steps round the circumference separate them. Listing 1 shows a class to calculate distances between cities.
    namespace tsp
    {
      class distances
      {
      public:
        distances(size_t n);

        size_t size() const;
        double operator()(size_t step) const;
        double operator()(size_t i, size_t j) const;

      private:
        typedef std::vector<double> vector;

        size_t n_;
        vector distances_;
      };
    }
|
|
Listing 1
|
The constructor does most of the work, calculating the distances between cities 0 to n -1 steps apart. Listing 2 calculates the distances between cities.
    tsp::distances::distances(size_t n) : n_(n),
       distances_(n)
    {
      if(n_<3) throw std::invalid_argument("");

      static const double pi = acos(0.0) * 2.0;
      double theta = 2.0*pi / double(n_);
      double alpha = 0.0;

      vector::iterator first = distances_.begin();
      vector::iterator last = distances_.end();

      while(first!=last)
      {
        *first = 2.0 * sin(alpha/2.0);
        ++first;
        alpha += theta;
      }
    }
|
|
Listing 2
|
Of course we could have also exploited the reflectional symmetry that means the distance between cities separated by i and n - i steps are also the same, but I'm not keen to make the code more complex for the relatively small improvement that results.
The code to retrieve the distance between two cities is relatively simple and is shown in Listing 3.
    double
    tsp::distances::operator()(size_t step) const
    {
      if(step>=distances_.size())
         throw std::invalid_argument("");
      return distances_[step];
    }

    double
    tsp::distances::operator()(size_t i,
                               size_t j) const
    {
      if(i>=n_ || j>=n_)
         throw std::invalid_argument("");
      return (*this)((i>j) ? i-j : j-i);
    }
|
|
Listing 3
|
To calculate the length of a tour we need only iterate over it and sum the distances of each step (Listing 4, overleaf).
    double
    tsp::tour_length(const tour &t,
                     const distances &d)
      {
      if(t.size()==0)
         throw std::invalid_argument("");

      tour::const_iterator first = t.begin();
      tour::const_iterator next = first+1;
      tour::const_iterator last = t.end();

      double length = 0.0;
      while(next!=last) length += d(*first++,
                                    *next++);
      length += d(*first, t.front());

      return length;
    }
|
|
Listing 4
|
The final thing we'll need before we start generating tours is some code to keep track of the distribution of tour lengths. Listing 5 shows a class to maintain a histogram of tour lengths.
    namespace tsp
    {
      class tour_histogram
      {
      public:
        struct value_type
        {
          double length;
          size_t count;
          value_type();
          value_type(double len, size_t cnt);
        };

        typedef std::vector<value_type>
           histogram_type;
        typedef histogram_type::
           size_type size_type;
        typedef const value_type &
           const_reference;
        typedef histogram_type::
           const_iterator const_iterator;

        tour_histogram();
        explicit tour_histogram(size_t vertices);
        tour_histogram(size_type vertices,
                       size_type buckets);

        bool      empty() const;
        size_type size() const;
        size_type vertices() const;

        const_iterator begin() const;
        const_iterator end() const;
        const_reference operator[](
            size_type i) const;
        const_reference at(size_type i) const;
        void add(double len, size_t count = 1);

      private:
        void init();
        size_type      vertices_;
        histogram_type histogram_;
      };
    }
|
|
Listing 5
|
Most of the member functions of our histogram class are pretty trivial, so we'll just look at the interesting ones. Firstly, the constructors. Listing 6 shows how the tour histograms are constructed.
As you can see, unless we specify otherwise, we'll use twice as many buckets as we have vertices. This is because we've already proven that the maximum tour length is bounded above by 2 n , so it makes sense to restrict our histogram to values between 0 and 2 n and dividing this into unit length ranges is a natural choice.
The init member function simply initialises the ranges for each of the buckets and sets their counts to 0. Note that, for our default histogram, the bucket identified with length l records tours of length greater than or equal to l -1 and less than l .
Listing 6 shows initialising the tour histogram.
    tsp::tour_histogram::tour_histogram(
       size_t vertices) :

    vertices_(vertices),

    histogram_(2*vertices)

      {
        init();
      }

    tsp::tour_histogram::tour_histogram(
       size_type vertices,
       size_type buckets) :

    vertices_(vertices),

    histogram_(buckets)

    {
      init();
    }

    void
    tsp::tour_histogram::init()
    {
      if(empty()) throw std::invalid_argument("");

      double step =
         double(2*vertices_) / double(size());
      double length = 0.0;

      histogram_type::iterator first
         = histogram_.begin();
      histogram_type::iterator last
         = histogram_.end();
      --last;

      while(first!=last)
      {
        length += step;
        *first++ = value_type(length, 0);
      }

      *first = value_type(double(2*vertices_), 0);
    }
|
|
Listing 6
|
We can exploit the fact that our histogram buckets are distributed evenly over the range 0 to 2 n when recording tour lengths. To identify the correct bucket we need only take the integer part of the tour length multiplied by the number of buckets and divided by 2 n .
Listing 7 shows adding a tour to the histogram
    void
    tsp::tour_histogram::add(double len)
    {
      size_type offset((double(size())*len)/
         histogram_.back().length);
      if(offset>=size())
         throw std::invalid_argument("");
      histogram_[offset].count += 1;
    }
|
|
Listing 7
|
Now we have all of the scaffolding we need to start measuring the properties of random tours of the regular TSP. Before we start, however, we should be mindful of the enormity of the task we have set ourselves.
The problem is that the number of tours grows extremely rapidly with the number of cities. For a TSP with n cities, we have a total of n ! tours which are going to take a lot of time to enumerate.
Table 1 shows the growth of n ! with n .
|
||||||||||||||||||
|
Table 1
|
We can improve matters slightly by considering symmetries again.
Firstly we have a rotational symmetry, in that we can start at any of the cities in a given tour and generate a new tour. By fixing the first city, we improve matters by a factor of n .
Secondly we have a reflectional symmetry in that we can follow any given tour backwards and get a new tour. By fixing which direction we take around the polygon, we reduce the complexity of the problem by a further factor of 2.
Whilst exploiting the rotational symmetry is relatively straightforward, the reflectional symmetry once again requires quite a bit of house-keeping. Hence I shall only attempt to exploit the former for the time being.
The first thing we're going to need is a way to generate the initial tour.
      void
      tsp::generate_tour(tour::iterator first,
                         tour::iterator last)
      {
        size_t i = 0;
        while(first!=last) *first++ = i++;
      }
Once we can do that it is a simple matter of iterating through each of the remaining tours and adding their lengths to our histogram. Fortunately there's a standard function we can use to iterate through them for us; std::next_permutation . This takes a pair of iterators and transforms the values to the lexicographically next largest permutation, returning false if there are no more permutations.
Using this function to calculate the histogram of tour lengths is relatively straightforward, as shown in Listing 8.
    void
      tsp::full_tour(tour_histogram &histogram)
      {
        distances dists(histogram.vertices());
        tour t(histogram.vertices());
        generate_tour(t.begin(), t.end());

        do histogram.add(tour_length(t, dists));
        while(std::next_permutation(t.begin()+1,
                                    t.end()));
      }
    }
|
|
Listing 8
|
Note that exploiting the rotational symmetry of the starting city is achieved by simply leaving out the first city in our call to std::next_permutation .
Now we are ready to start looking at the results for some tours, albeit only those for which the computational burden is not too great.
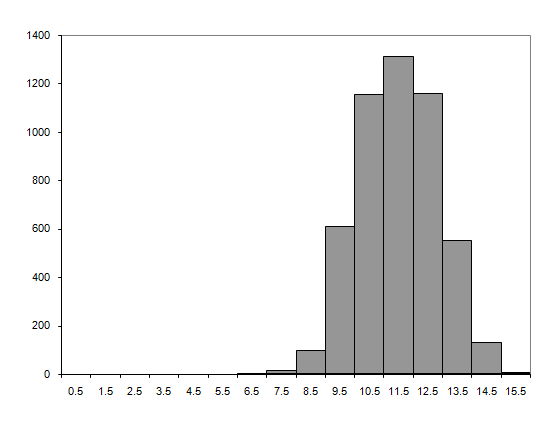
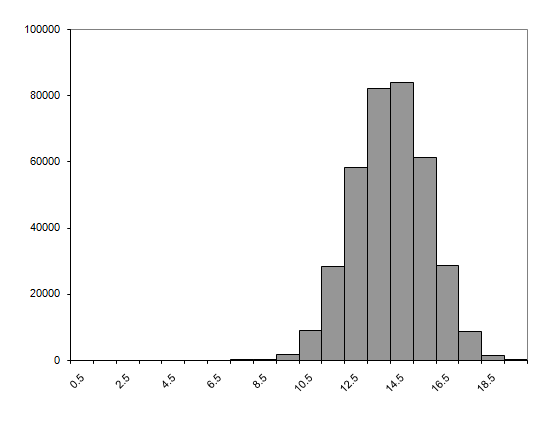
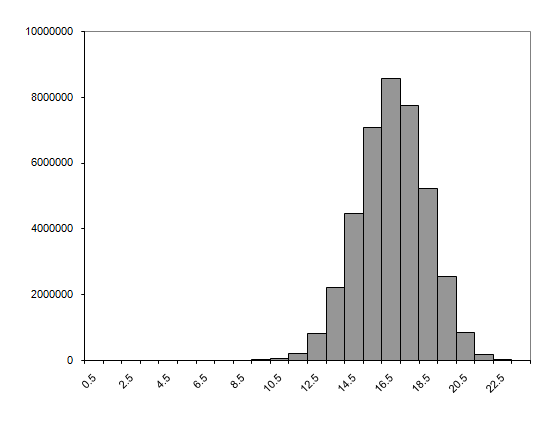
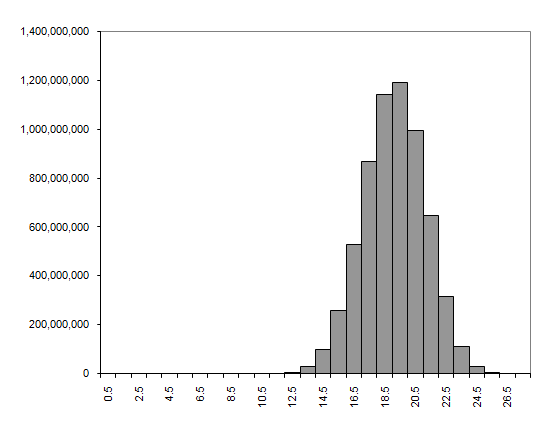
Figure 8 shows the tour histograms for 8, 10, 12 and 14 city regular TSPs.
|
|
Figure 8
|
We can also use the histograms to calculate an approximate value for the average length of the tours. We do this by assuming that every tour that is added to a bucket has length equal to the mid-point of the range for that bucket. For our default number of buckets, this introduces an error of at most 0.5, which for large n shouldn't be significant. If you're not comfortable with this error it would not be a particularly difficult task to adjust the add member function to also record the sum of the tour lengths with which you could more accurately calculate the average length. I'm not going to bother though.
The approximate average lengths of the above tours, as both absolute length and in proportion to the number of cities, are given in Table 2.
|
|||||||||||||||
|
Table 2
|
The distributions shown by the histograms and the average tour lengths both hint at a common limit for large n , but unless we can analyse longer tours we have no way of confirming this. Unfortunately, the computational expense is getting a little burdensome as Table 3 illustrates.
|
||||||||||
|
Table 3
|
So can we reduce the computational expense of generating the tour histograms? Well that, I'm afraid, is a question that shall have to wait until next time
Acknowledgements
With thanks to Larisa Khodarinova for a lively discussion on group theory that lead to the correct count of distinct tours and to Astrid Osborn and John Paul Barjaktarevic for proof reading this article.
References & Further Reading
[ Clay] Clay Mathematics Institute Millennium Problems, http://www.claymath.org/millennium.
[ Archimedes] Archimedes, On the Measurement of the Circle , c. 250-212BC.
[ Beardwood59] Beardwood, Halton and Hammersley, The Shortest Path Through Many Points, Proceedings of the Cambridge Philosophical Society, vol. 55, pp. 299-327, 1959.
[ Jaillet93]Jaillet, Analysis of Probabalistic Combinatorial Optimization Problems in Euclidean Spaces, Mathematics of Operations Research, vol. 18, pp. 51-71, 1993.
[ Agnihothri98] Agnihothri, A Mean Value Analysis of the Travelling Repairman Problem, IEE Transactions, vol. 20, pp. 223-229, 1998.
[ Basel01] Basel and Willemain, Random Tours in the Travelling Salesman Problem: Analysis and Application, Computational Optimization and Applications, vol. 20, pp. 211-217, 2001.
[ Hoffman96] Hoffman and Padberg, Travelling Salesman Problem, Encyclopedia of Operations Research and Management Science, Gass and Harris (Eds.), Kluwer Academic, Norwell, MA, 1996.